Modeling a gas with unique properties
The challenges of climate change are intricately linked to the successful implementation of carbon capture and storage (CCS) strategies. Central to these strategies is the efficient management of CO2 transportation pipelines, which presents distinct challenges.
Unlike typical gases, CO2 exhibits unique properties, such as heightening the susceptibility to corrosion, elevated operational pressures and the potential for phase transitions. These unique properties necessitate innovative solutions.
Developing accurate and reliable simulation models is crucial to effectively address CO2’s distinctive challenges. It highlights the pivotal role played by equations of state in precisely modeling CO2 pipeline behavior, comparing their performance across various operating conditions. In this blog, Senior Simulation Consultant Garry Hanmer discusses:
- CO2 transportation challenges and how pipeline simulation can help
- The challenges of modeling CO2
- The performance of widely used equations of state, including Peng Robinson, GERG 2004, Benedict Webb Rubin Starling (BWRS) and AGA8
- These equations of state compared on an operational case study pipeline
CO2 transportation
Transporting small quantities of CO2 in its gaseous or liquid phase is a common practice, but for larger volumes, high-pressure systems become necessary. In these cases, CO2 is typically transported in a supercritical state under conditions of elevated pressure and temperature. CO2 is in a more compact form in this state, so the risk of phase transition during transportation increases.
Maintaining the supercritical state demands precise control over pressure and temperature, which introduces complexity to both pipeline design and operation. The supercritical phase of CO2 occurs at temperatures and pressures above the critical point, with a critical temperature of 31.1 degrees Celsius (304 Kelvin) and a critical pressure of 73.8 bar. In this phase, CO2 exhibits properties of both gas and liquid.
Effectively managing phase transitions during CO2 transport is crucial. Insulation, pressure control, and temperature management are essential components in preventing unintended phase changes that could adversely impact pipeline efficiency and integrity.
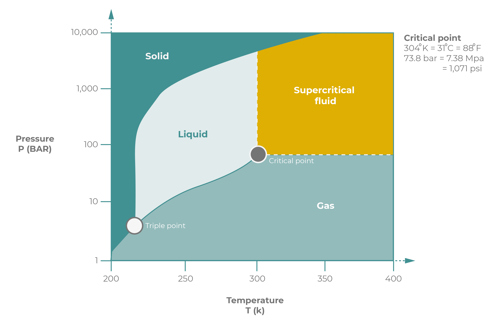
Figure 1: The phase diagram illustrates how its state changes with variations in temperature and pressure
The challenge and how pipeline simulation can help
Understanding CO2’s behavior across different phases is essential for the effective design of transportation and storage systems.
The logistical complexities of transporting CO2 over extended distances requires the consistent maintenance of pressure and temperature conditions along the entire pipeline route. An unexpected change in the pressure or temperature conditions can affect the pipeline's efficiency, giving rise to safety concerns or equipment malfunctions.
Ensuring the long-term integrity of the pipelines requires proactive maintenance strategies. Regular inspections, both internally and externally, along with addressing potential sources of wear and tear, are vital but can be logistically demanding, particularly in remote or inaccessible areas.
The timely detection of leaks presents challenges due to the nature of CO2, requiring advanced and reliable leak detection systems. These systems are essential for quick responses to minimize the environmental and safety impact of potential leaks.
Using pipeline simulation software like Atmos SIM, a digital twin involving virtual replicas of the pipeline and its operational conditions can be built. Modeling a pipeline also enables real-time monitoring, analysis and decision-making, which enhances the overall operational efficiency and safety of the pipeline.
The challenges of modeling CO2
CO2 undergoes significant phase transitions with variations in temperatures and pressures. Simulating the complex behavior during these transitions demands advanced models and precise thermodynamic data.
The physical pipelines operate under dynamic conditions, experiencing fluctuating pressures and temperatures. Simulating these variations accurately is crucial for understanding the pipeline and fluid behavior to ensure safe and efficient operations. Challenges to simulation accuracy also arise from factors like impurities present in the transported fluid.
Integrating with SCADA systems can help with incorporating real-time data into simulations for real-time decision-making, however the variability in CO2 properties, such as impurity levels, introduces uncertainties that must be addressed for realistic simulations. Continuously validating simulation models against real-world data and calibrating them for accuracy remains an ongoing challenge.
Which equation of state is most appropriate for modeling CO2?
Selecting the most appropriate equation of state for modeling CO2 requires careful consideration. The chosen equation of state must be applicable to compositional fluids and exhibit accuracy across the entire operational range of pressures and temperatures, among other things.
GERG 2004
GERG 2004 is a composition-based equation of state that employs a thermodynamic model to characterize the thermodynamic properties of gas mixtures. While especially beneficial for simulating the behavior of natural gas mixtures, it can also be applied to the simulation of CO2.
AGA8
AGA8 is designed for determining the thermodynamic properties of natural gas and gas blends. It relies on empirical data and has undergone thorough validation, utilizing a substantial dataset of experimental information.
Peng Robinson
Peng Robinson is a composition-based cubic equation of state that uses a thermodynamic model to calculate the properties of fluids. It is based on the principle of the theory of corresponding states, which states that fluids at the same reduced temperature and reduced pressure have similar properties.
Benedict Webb Rubin Starling
The Benedict Webb Rubin Starling equation of state is a composition-based non-cubic equation of state utilizing a thermodynamic model to establish the correlation between a fluid's pressure, temperature, and volume with its molecular properties. It is commonly used to model the behavior of natural gas and other hydrocarbon mixtures, but it can also be used to model CO2.
Comparing the equations of state on a CO2 pipeline
This pipeline carries pure CO2 and is 75 km (47 miles) long and runs west to east along a mainline section. The pipeline passes through six block valve stations.

Figure 2: The case study pipeline layout
To compare the different equations of state, a snapshot of the capacity flow rate from the physical case study pipeline was recorded. This snapshot included the flow, pressure and temperature measurements.
The simulation model could then be setup with the pressure and temperature measurements as boundary conditions and the model could then calculate the capacity flow rates for comparison with the measurement values. These flow rates were calculated using the GERG 2004, BWRS, Peng Robinson and AGA8 equations of state.

Table 1: Calculated pipeline capacities for each of these equations of state along with the capacity flow rate taken from the case study pipeline. A column for the equation of state percentage accuracies is also given.
The Peng Robinson equation of state showed the largest deviation between the flow measurement and calculated values with a 1.21% error. The BWRS and AGA 8 equation of state performed well with deviations of 0.76% and 0.49% respectively. Gerg 2004 performed optimally with a deviation of just 0.38%. There are particularly high differences for the Peng Robinson equation of state, demonstrating that this equation of state is not suitable for modeling CO2 within these conditions.
The density values were also compared between the equations of state. Density measurements were not available for the case study pipeline so they were compared against experimental data recorded by NIST (National Institute of Standards and Technology) to get an understanding of the differences.

Table 2: The density, pressure and temperature at the pipeline inlet with each of the different equations of state
There are large deviations between the densities of the BWRS and Peng Robinson equation of state and the NIST experimental value. This reflects the expected behavior of these equations at and around the critical pressure. The Gerg 2004 and AGA8 equations showed much better alignment with the NIST experimental value as suggested by the overall accuracy within the case study pipeline results.
Atmos SIM is a fundamental part of advancing CO2 transportation technologies
The incorporation of advanced simulation tools is crucial in tackling the challenges facing CO2 pipeline operators, such as safety, operational efficiency, environmental impact, and regulatory challenges.
Equations of state play a fundamental role in modeling the thermodynamic behavior of CO2 within pipelines. The GERG 2004 equation of state was found to perform most accurately. The alternatives tested (Peng Robinson, BWRS and AGA8) as part of this study were found to be less accurate for supercritical fluids and did not handle phase transitions optimally.
For more information about how we address the CO2 pipeline challenges using simulation tools, download our paper in full, which was first presented at the Pipeline Technology Conference 2024.